Most dashboards look impressive.
But when leadership asks, “What should we do next?”, the room often goes quiet.
Marketing reports on reach, clicks and engagement. Sales teams track calls, meetings and pipeline. Leadership reviews performance summaries that appear comprehensive but often lack the clarity required to guide strategic decisions.
A lack of data is not the issue businesses face, but rather a lack of structure.
Revenue operations metrics exist to solve this problem. They move measurement away from reporting activity and toward understanding what actually drives pipeline, conversion and revenue outcomes.
The Difference Between Marketing Metrics and Revenue Metrics
Marketing metrics show what happened. RevOps metrics show what needs attention.
This distinction matters more than most organisations realise.
Metrics like impressions, clicks and traffic can indicate whether campaigns are running effectively, but they don’t explain whether those activities translate into meaningful commercial outcomes. A campaign can generate volume without producing viable opportunities, which is why many teams find themselves constantly optimising performance without improving results.
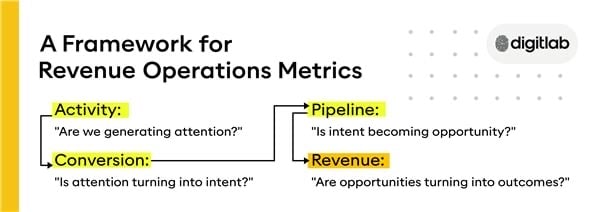
Revenue operations metrics shift the focus. Instead of asking “what happened,” they ask, “what moved the pipeline forward?” This is where alignment with systems like CRM becomes a pivotal part of the process. Without structured data and consistent definitions, even well-performing campaigns struggle to translate into measurable revenue impact. A challenge explored further in this breakdown of why CRM systems fail without leadership discipline.
A Framework for Revenue Operations Metrics
To move beyond reporting, metrics need to be structured into a clear hierarchy. Not all metrics serve the same purpose, and without this distinction, dashboards can easily become cluttered and difficult to interpret.
A useful framework separates metrics into four layers: activity, conversion, pipeline and revenue performance. Most dashboards mix these layers together.
That’s why teams struggle to see what actually needs attention.
Activity metrics reflect top-level engagement, like traffic, impressions, and reach. They provide directional insight but shouldn’t guide decisions in isolation.
Conversion metrics introduce intent, tracking how users move between stages from visitor to lead, or from lead to qualified opportunity. These metrics reveal friction within the system.
Pipeline metrics focus on opportunity progression, stage movement, deal velocity and conversion between sales stages. This is where marketing and sales alignment becomes visible.
Revenue performance metrics connect activity to commercial outcomes, including revenue generated, deal size, customer acquisition cost and lifetime value.
When structured correctly, this framework creates a clear line of sight from initial engagement through to revenue. Without it, reporting becomes fragmented and difficult to act on.
Why Most Dashboards Don’t Drive Decisions
Many dashboards fail because of how the data is organised and interpreted, not because of missing data.
It’s common to see 20+ metrics on a dashboard, but no clear indication of which one actually needs attention. So teams end up reviewing performance, rather than deciding what to do. In these environments, data becomes descriptive rather than prescriptive.
This is particularly visible in lead generation environments where activity increases without corresponding improvements in pipeline quality. Teams then start to realise that more leads don’t necessarily translate into better outcomes when qualification systems are weak.
RevOps metrics address this by structuring data around decisions. So instead of asking teams to interpret everything, they highlight what matters most and where intervention is necessary.
The Revenue Operations Reporting Hierarchy
For metrics to properly guide behaviour, they need to be organised into a reporting hierarchy that reflects how decisions are made across the business. Most organisations try to give everyone the same dashboard. That’s where confusion starts.
A more effective approach is to align metrics to how decisions are actually made:
- Leadership level – revenue and pipeline visibility. Focused on total pipeline value, revenue performance, and forecast accuracy.
- Operational level – conversion and flow. Focused on lead-to-opportunity conversion, stage progression, and deal velocity.
- Execution level – activity and engagement. Focused on campaign performance, outreach activity, and engagement signals.
When these levels are separated clearly, teams stop reporting everything and focus on the metrics that are most relevant to their decisions.
Designing a RevOps Dashboard That Actually Guides Decisions
A useful dashboard doesn’t answer every question. It highlights where to look next.
Metrics should be prioritised based on their ability to influence decisions, not simply because they are readily available. Each metric should answer a specific question, like where the pipeline is slowing down, which channels are driving qualified opportunities, or where conversion rates are declining.
Equally important is consistency. Definitions for key metrics like MQLs, SQLs, and opportunities must be aligned across teams to ensure that reporting reflects the reality rather than interpretation. Without this discipline, dashboards become a source of confusion rather than clarity.
Each metric should answer a specific question:
- Where is the pipeline slowing down?
- Where are leads dropping out?
- Which channels are driving qualified opportunities?
- Where is conversion declining?
- What is impacting revenue outcomes?
For a broader view of how these systems connect, this overview of Revenue Operations provides useful guidance on how it streamlines the customer journey.
Alignment Metrics and Pipeline Accountability
One of the most important roles of revenue operations metrics is to create accountability across marketing and sales. This is where alignment metrics become essential.
Metrics such as lead acceptance rates, time to follow-up, and conversion from MQL to sales-qualified opportunities (SQLs) provide visibility into how effectively teams are working together. Without these metrics, misalignment becomes invisible. Marketing can look productive while sales struggles to convert, and neither team can explain why.
By introducing shared metrics, organisations can move from isolated performance tracking to a more integrated view of pipeline performance. This is also where lead generation strategies need to be evaluated within a broader system, rather than as isolated campaigns
Data Without Consequence Is Noise
If a metric doesn’t change behaviour, it isn’t useful. RevOps metrics are valuable because they create consequence. They highlight where performance is misaligned with expectations and provide a basis for decision-making.
Digitlab’s State of Digital Report points to a consistent pattern: most businesses aren’t short on data, but they struggle to distinguish between activity and what actually drives revenue.
Consider this:
A business sees lead volume increasing, but no one is tracking lead-to-opportunity conversion. Marketing continues to scale campaigns, while sales struggles to convert, and the issue goes unnoticed.
Or pipeline value appears to be strong, but deal velocity slows. Without visibility into stage movement, this only becomes visible when revenue targets are missed.
If conversion rates drop, the response should be clear and fast. If the pipeline slows, the cause should be visible. If not, the data isn’t doing its job. The purpose of metrics isn’t to report performance, but to change behaviour.
Revenue Operations Metrics as a Leadership Discipline
Ultimately, RevOps metrics aren’t a marketing exercise. They are a leadership discipline. They require alignment across systems, clarity in definitions and a commitment to measuring what actually drives outcomes.
Organisations that approach metrics in this way gain a clearer understanding of how their marketing, sales and CRM systems contribute to revenue. Those that don’t often find themselves optimising activity without improving results.
Most businesses don’t have a data problem. They have a visibility problem: they can see activity, but not what’s driving revenue.